
Customer Behavior Modelling
Customer Analytics / Churn and Retention Analysis
This project utilizes free customer data from Kaggle to explore, predict, and visualize customer behavior.
The main goal is to understand churn patterns, segment customers using behavioral metrics, and communicate insights through interactive Power BI dashboards, along with my thought process behind every decision and model used.
Our data from Kaggle was relatively clean, requiring minimal preprocessing.
Males represent approximately 46.64% of the dataset, with 38.58% of them churning. In comparison, 18,911 out of 34,353 females churned.
I engineered new features to enhance the analysis:
- Engagement Ratio: Usage frequency divided by tenure.
- Age Groups: Customers grouped by age ranges.
- New Customers: Customers with less than 6 years of tenure.
- Frequent Caller: Based on the assumption that frequent support calls may be related to churn.
- Payment Issue: Derived from the "Payment Delay" variable, assuming customers with delays may be at risk due to financial constraints or contract neglect.
For encoding:
- OrdinalEncoder was used for categorical variables with an inherent order.
- LabelEncoder was used for nominal variables such as gender.
The dataset was balanced and did not require SMOTE or other resampling techniques.
A major goal was to evaluate various classification models for churn prediction. The best model was:
- Random Forest Classifier with an accuracy of 0.99844 and an F1 score of 1.0.
- This slightly outperformed Gradient Boosting by 0.001.
- KNN, SVM, and Logistic Regression also performed reasonably well.
Customer Segmentation:
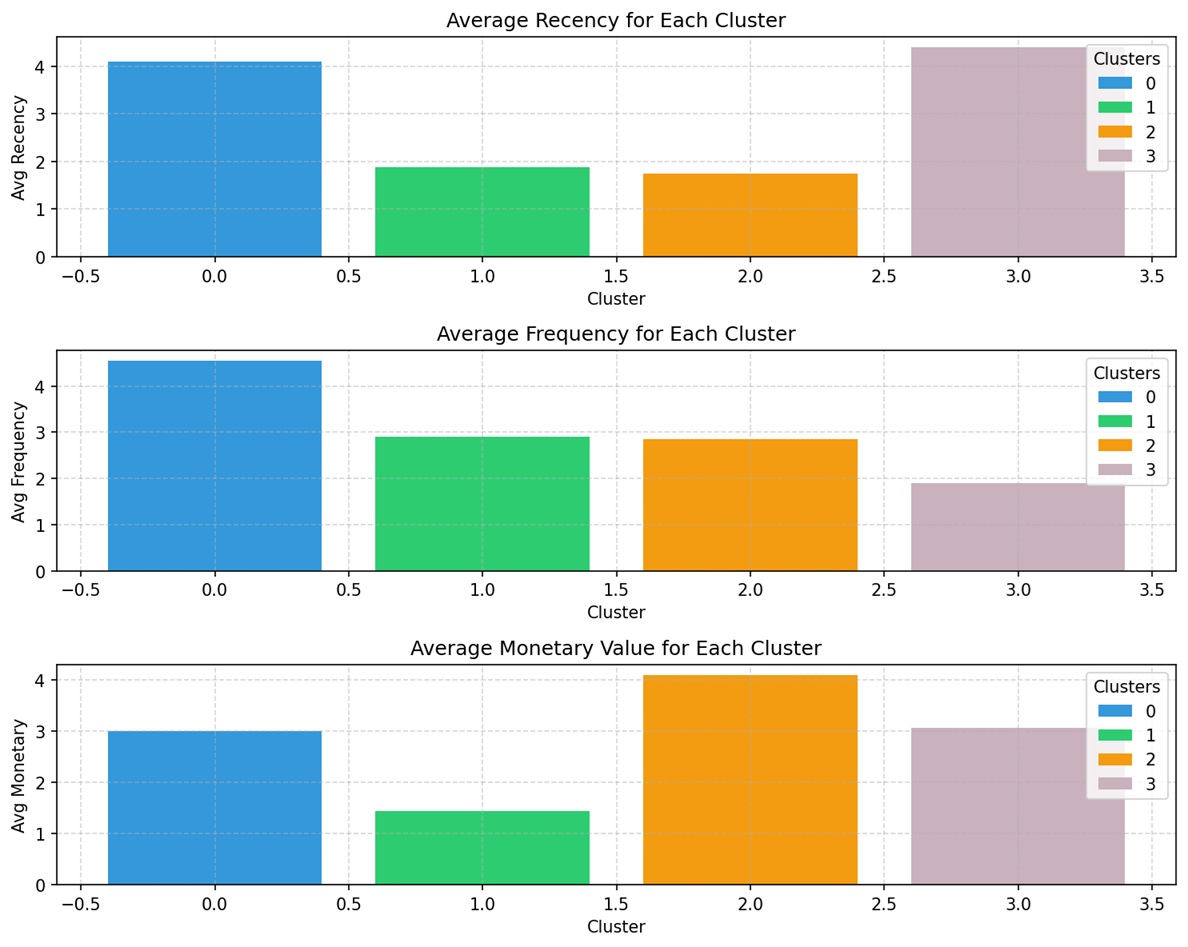
We applied RFM (Recency, Frequency, Monetary) analysis and K-Means clustering for customer segmentation. Key insights include:
- Customers with higher recency scores tend to spend more, though the pattern is not strictly linear.
- Customers with moderate to high frequency also tend to be higher spenders, though not always.
The clustering produced four distinct segments:
- Loyal Moderate Spenders
- At-Risk Low Spenders
- High-Value Dormant
- New/Recent Customers
| Cluster | Suggested Segment | Characteristics | Suggested Action |
|---|---|---|---|
| 0 | Loyal Moderate Spenders | Recent, frequent, moderate spend | Upselling, loyalty programs |
| 1 | At-Risk Low Spenders | Inactive, moderate past interaction, low spend | Reactivation campaigns |
| 2 | High-Value Dormant | Inactive, some past interaction, high spend | High-priority win-back |
| 3 | New/Recent Customers | Very recent, low interaction, moderate spend | Nurturing and engagement |
We asked: Do churn rates align with these segments? After analysis, we found that the segmentation holds well overall. However, Cluster 2 would be better labeled as High-Value Steady Customers to reflect their consistent behavior and value.
Recommended Strategies by Segment:
| Cluster | Adjusted Segment Name | Characteristics | Business Strategy |
|---|---|---|---|
| 0 | Loyal Moderate Spenders | Recent, frequent, moderate spend, low churn | Retention & Upselling: Loyalty rewards, personalized offers to increase spend, referral incentives |
| 1 | At-Risk Low Spenders | Inactive, moderate past interaction, higher churn | Reactivation Campaigns: Targeted discounts, reminders, win-back emails, understand reasons for churn |
| 2 | High-Value Steady Customers | Moderate activity, high spend, low churn | Protect & Reward: VIP treatment, premium support, early access to offers, prevent churn at all costs |
| 3 | New/Uncertain Customers | Recent interaction, low interaction frequency, moderate churn | Onboarding & Engagement: Educational content, welcome offers, early satisfaction surveys to build loyalty |
I also used Power BI to show KPIs and some analysis. View KPI Dashboard
View Project